
See your contact centre in real time — on any screen.
One board across Connect, CXone, Genesys, Avaya, RingCentral and Zoom — from US$180 per tenant.
 Available on AWS MarketplaceLiveUCX Contact Center Dashboard · consolidated AWS billing
Amazon Connect · NICE CXone · Genesys · Avaya · RingCentral · Zoom — web, mobile & kiosk A wallboard is not workforce management, and the two get conflated in procurement — here is the difference.
NICE CXone partner — listed on CXexchange
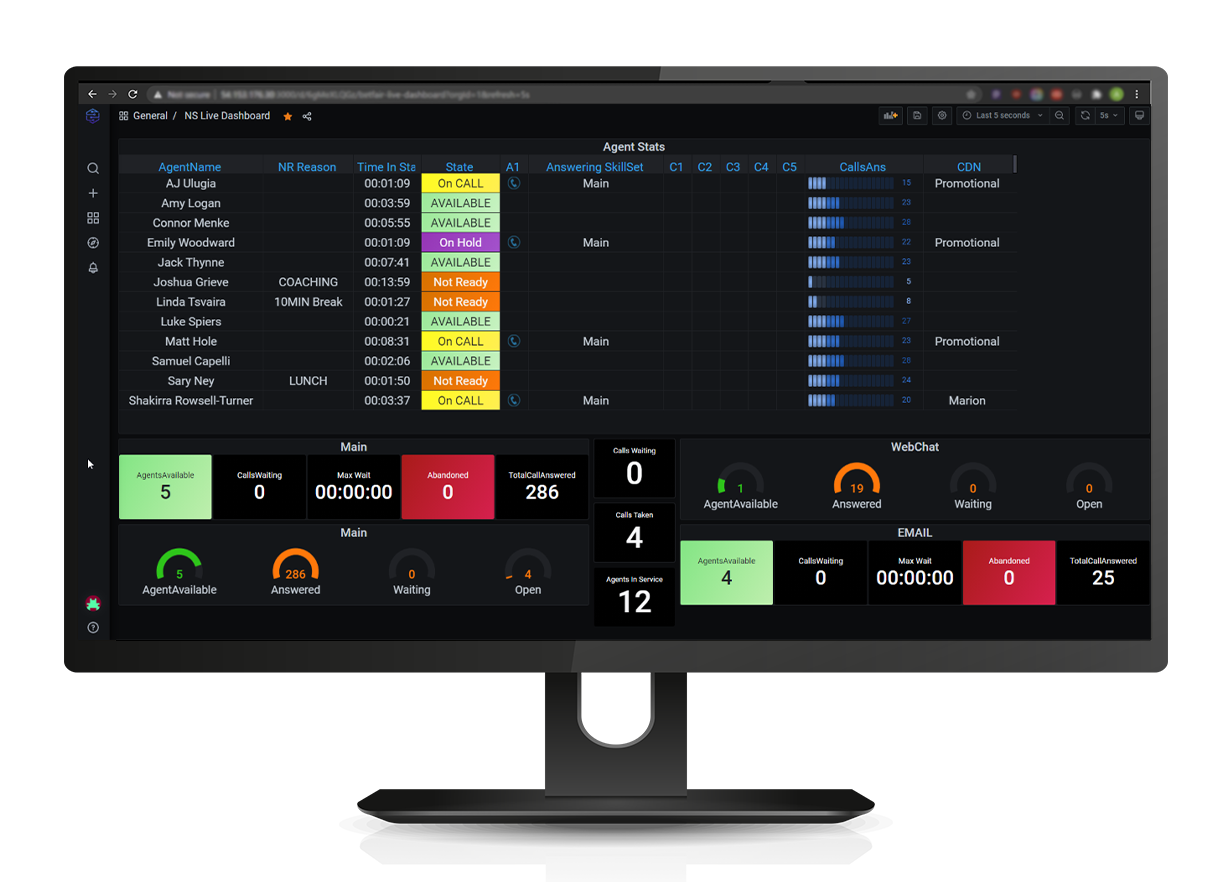




Pre-built connectors for Amazon Connect, NICE CXone, Genesys, Avaya, RingCentral and Zoom — automatically merging ACD metrics with your other systems in real time, typically deployed in around two days.

Metrics, graphs, pie charts, gauges, heat maps, tables and panels — 20+ charting tools with custom calculations like live SLA.

Colour thresholds plus alerts across 15 channels including email, SMS, Teams and Slack — even external lights and webhooks.

Map agents onto a floor plan and see live status at a glance, with detailed time-in-state and reasons.

Blend ACD metrics with business data from SQL Server, MySQL, PostgreSQL, Prometheus, InfluxDB, Azure Monitor and more.

Rotate dashboards on TVs and kiosks, and publish public dashboards — e.g. to advertise live queue times.

Responsive design for any device; real-time updates only when on-screen, so there's no battery or data overhead.
Real-time, customisable & engaging
A fully web-based solution for displaying real-time data on contact-centre wallboards, supervisor screens and executive mobiles. Already using your platform's built-in metrics page? We compare the two in Amazon Connect real-time metrics vs a wallboard.
Your contact centre, in your pocket
LiveUCX dashboards are web-based and built with a purpose-driven responsive design, so supervisors and executives can keep an eye on the floor from any device.
On-the-go analytics
Seamless viewing from any device — phone, tablet or desktop.


Subscribe through the marketplace you already buy from
LiveUCX Contact Center Dashboard — consolidated AWS billing.
LiveUCX Dashboard for RingCentral contact centres.
LiveUCX Dashboard on the Avaya Cloud Office gallery.
LiveUCX Dashboard — ProUCX is a NICE CXone partner.
Out-of-the-box insight, tailored to you
Get real-time visibility into your contact centre without weeks of custom development. Need it customised? We've got you. Prefer consolidated AWS billing? Subscribe on AWS Marketplace.
Six contact-centre platforms, one wallboard
Most wallboard projects stall on the same thing: getting the live data out of the ACD and onto a screen without building an integration first. LiveUCX ships pre-built connectors for the platforms below, so the work is configuration rather than development.
Pre-built connectors for all six. If you run more than one platform — common after an acquisition, or mid-migration — the boards look the same across them, which is usually the point.
Because the connector already exists, a first set of boards is typically in front of the floor in around two days rather than a quarter. Your own timeline depends on how much custom calculation you want in the first pass.
Queue and agent statistics alongside business data from SQL Server, MySQL, PostgreSQL, Prometheus, InfluxDB and Azure Monitor. A board showing only ACD metrics tells the floor half the story — sales, orders and SLA context live elsewhere.
Listed on several marketplaces, including AWS Marketplace, so it bills against the AWS account you already have, and NICE CXexchange as a NICE partner listing.
Wall-mounted TVs, kiosks, supervisor desktops and phones all render the same boards. Playlists rotate dashboards on a screen, and public dashboards can be published — to advertise live queue times, for instance.
This is a real-time display layer, not a reporting warehouse. It is for the decision a supervisor makes in the next ninety seconds; historical analysis stays where you already do it.
Priced per tenant, not per agent
Wallboards are usually licensed per agent, which makes them expensive precisely when you most want a screen on the wall — a big floor. LiveUCX is licensed per tenant, so the cost does not move when you add headcount or hang another television.
Per tenant, not per agent or per screen. Advanced is US$240 and Premium US$360 per month; a self-hosted deployment for organisations that need it inside their own environment is US$600.
On AWS Marketplace it lands on your existing AWS bill and counts toward AWS commitments. Direct billing suits teams whose AWS account sits in a different part of the business.
Colour thresholds on any metric, plus alerting across fifteen channels including email, SMS, Teams and Slack — and external lights and webhooks where the floor responds better to a lamp than a notification.
Already using your platform’s built-in metrics page? We compare the two in Amazon Connect real-time metrics vs a wallboard, including where the native page is genuinely enough.
Common questions
A live display of queue and agent state that the whole floor can see — calls waiting, longest wait, agents available, service level against target. The point is not the data, which already exists in the platform, but that everyone sees the same number at the same moment and can react to it.
Amazon Connect has a real-time metrics page, which is a supervisor view rather than a wall display, and for small teams it is often enough. We set out where the native page stops in Amazon Connect real-time metrics vs a wallboard.
Amazon Connect, NICE CXone, Genesys, Avaya, RingCentral and Zoom, each with a pre-built connector. Boards look the same across platforms, which matters if you run more than one.
Typically around two days to a first set of boards, because the platform connector already exists and the work is configuration. How long the whole rollout takes depends on how much custom calculation and how many layouts you want.
LiveUCX is licensed per tenant from US$180 per month, with Advanced at US$240 and Premium at US$360, and a self-hosted option at US$600. Per-tenant pricing matters because wallboards are commonly licensed per agent, which penalises exactly the large floors that most need a screen on the wall.
Yes, and it is usually what makes the board worth watching. Alongside ACD metrics you can pull from SQL Server, MySQL, PostgreSQL, Prometheus, InfluxDB and Azure Monitor, so sales, order or SLA figures sit next to calls waiting.
Both. The boards are web-based and responsive, so the same dashboard renders on a wall-mounted screen, a kiosk, a supervisor’s desktop or a phone. Playlists rotate boards on a screen, and updates are sent only while a view is on-screen.
Yes. Any metric can carry colour thresholds, and alerts go out across fifteen channels including email, SMS, Teams and Slack — plus external lights and webhooks, which on a busy floor often work better than another notification.